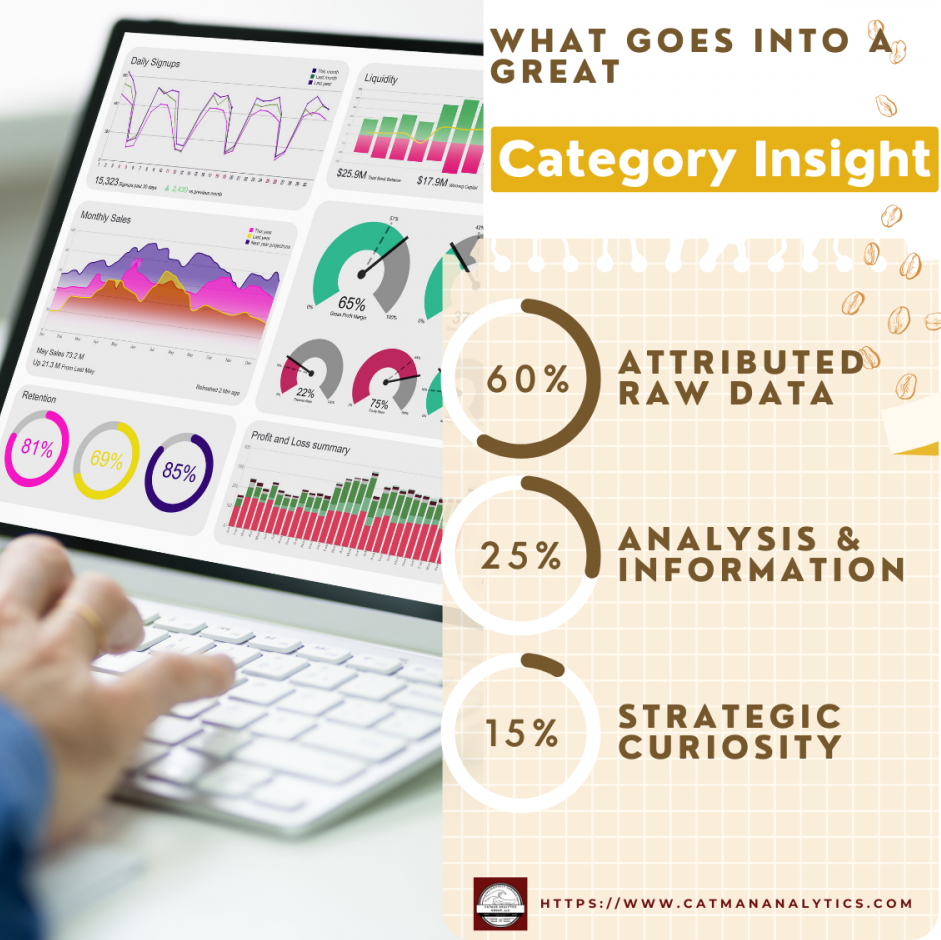
We all get the pressure to deliver game-changing category insights, it can be complex so let’s simplify the process:
What are the ingredients?
- 💻 Data (60%): It’s the raw material, the facts. But remember, it’s just numbers.
- 📈 Information (25%): This is processed data, easier for us to grasp. Think reports and dashboards.
- 💡 Strategic Curiosity (15%): The “AHA!” moments that drive action. They require asking the right questions.
So, What’s the Significance?
- Data provides the foundation, but insights are the magic sauce.
- Information reveals patterns, but insights drive decisions.
- Insights are like numbers with attitudes—they guide action.
What’s behind all this, Strategic Curiosity!
This is your way of asking What, SO What, and Now What into all that you analyze. This 15% effort into the analytics can return 1,000 better “actionable insights.
Ready to unleash the power of category insights and elevate your success?
Our team is here to assist you with your needs. Reach out via DM or contact us on our website to learn more!


Leave a Reply